Parents sometimes revert to the old adage, “Do as I say, not as I do!” when trying to raise kids to do the right and healthy thing. It seems the Federal Government has headed down the same path. And as consumers we’re off in our own direction, spending money in ways that ignore nutrition recommendations.
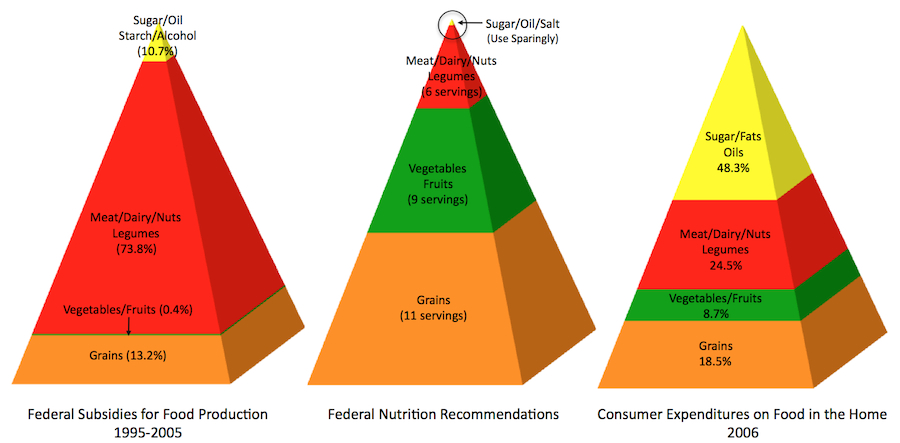
Above you will find three pyramids. On the left is a comparison of federal subsidies for food production for the years 1995-2005. On the right is a federal report comparing consumer expenditures on food eaten in the home. In the center is the familiar “food pyramid” which illustrates the recommended number of servings of four food groups. The categories are similar but not exactly the same.
The food pyramid has been modified and updated over the years. The version in use in 2005 (we’re trying to compare apples and apples, so to speak) recommended 11 servings of grains and grain products, 9 servings of fruits and vegetables, 6 servings of protein (including meat, dairy, nuts and legumes) and a small amount (use sparingly) of sugar, oil and salt.
Federal subsidies have more or less upended the pyramid. The question “Why does a salad cost more than a Big Mac?“ can be answered pretty simply by looking at where government subsidies are spent. Meat, dairy, nuts and legumes were awarded almost 3/4 of all subsidies for the decade 1995 to 2005. Grains for human consumption received only about 13% of the funds. The subsidy for sugar, starch, oil and alcohol (10.7%) was paid out for corn, sugar beets, canola and the 80% of sunflower seed that was used for oil. The fruit and vegetable category was represented by only one fruit – apples – which received less than 1/2 of one percent of all subsidies.
While we keep hearing admonitions to eat right and follow the federal nutrition guidelines, it’s pretty clear that we are voting with our dollars. Consumer expenditures on food eaten in the home are even more skewed away from the nutrition recommendations.
In 2006, food expenditures for the “average” American household of 2.5 persons (approximately 2 adults and .5 children under 18) was $6,111. More than half – $3,417 – was spent on food “away from home” and $2,694 on “food at home.”
In an attempt to compare the consumer expenditures across food categories, we considered “cereals and bakery products” to be more or less equivalent to grains – a stretch, I know. Meats, poultry, fish, eggs and dairy were grouped into a single category. Fruits and vegetables had a category of their own. And “sugar and other sweets” were grouped with “fats and oils.”
The food pyramid has been literally upended.
We found that the average family spent – for food in the home – about $2,400 in 2006 on these same four categories (more or less) described across the three sets of data. Nearly half the expenditures for the average family for these four food groups go to sugar and other sweets, fats and oil, and alcoholic beverages. Nearly a quarter of the expenditures go for protein (meat, dairy, eggs, nuts, legumes), less than one-fifth for grains (even allowing for bakery products), and less than 10% for fruits and vegetables. Two categories that are not included in the tables are “miscellaneous foods” and nonalcoholic beverages, which totaled almost $1000 per family in 2006.
I believe it was Mark Twain who often said there are “lies, damn lies, and statistics” (attributed to the 19th Century British Prime Minister Benjamin Disraeli), so we must tread carefully here. Regardless, the simple comparison makes it clear that neither our federal ag subsidy program nor our expenditures on food eaten in the home, show any relationship to what many consider a healthy diet.

